FAQs

Frequently Asked Questions


We will accept a return of any unbroken bundles of charts at any time, for a refund of the product amount. This offer will never expire. If you find any flaw with your charts, you can return them after contacting us about the problem and we will exchange them. If there is a printing error, if the drilled holes prevent them from feeding through a printer, or if they are damaged in shipment, we will replace them at no cost to you. We're pretty friendly! If you have a problem, please reach out to us!

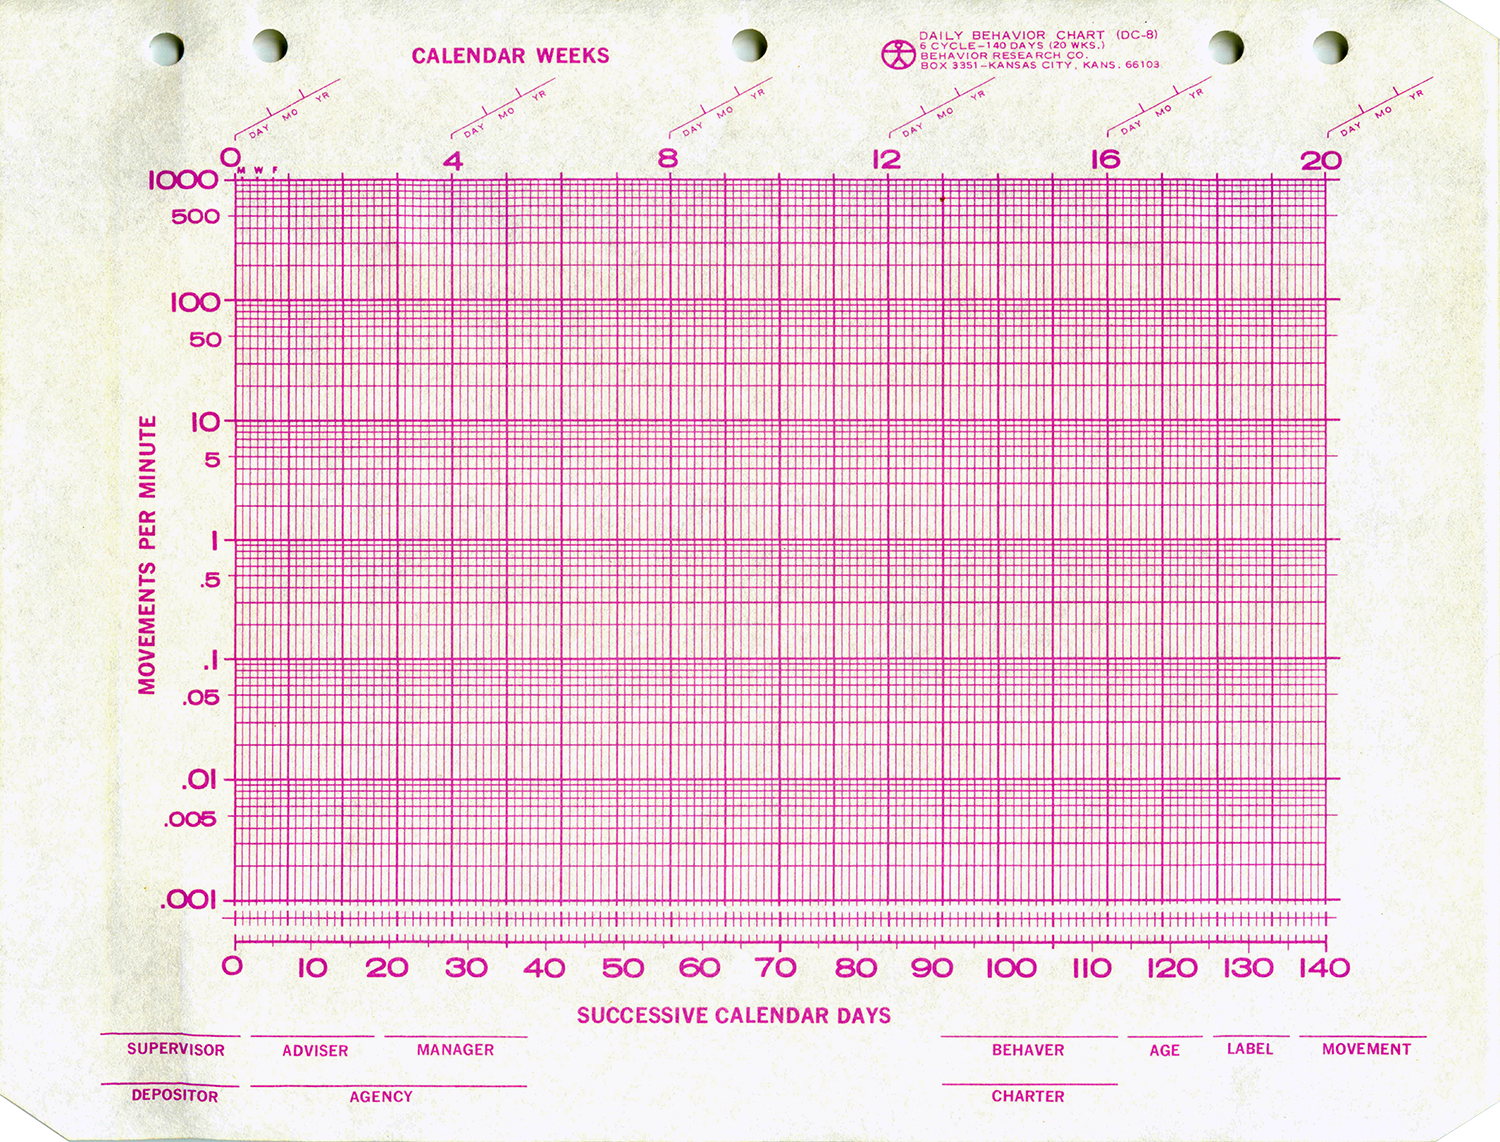
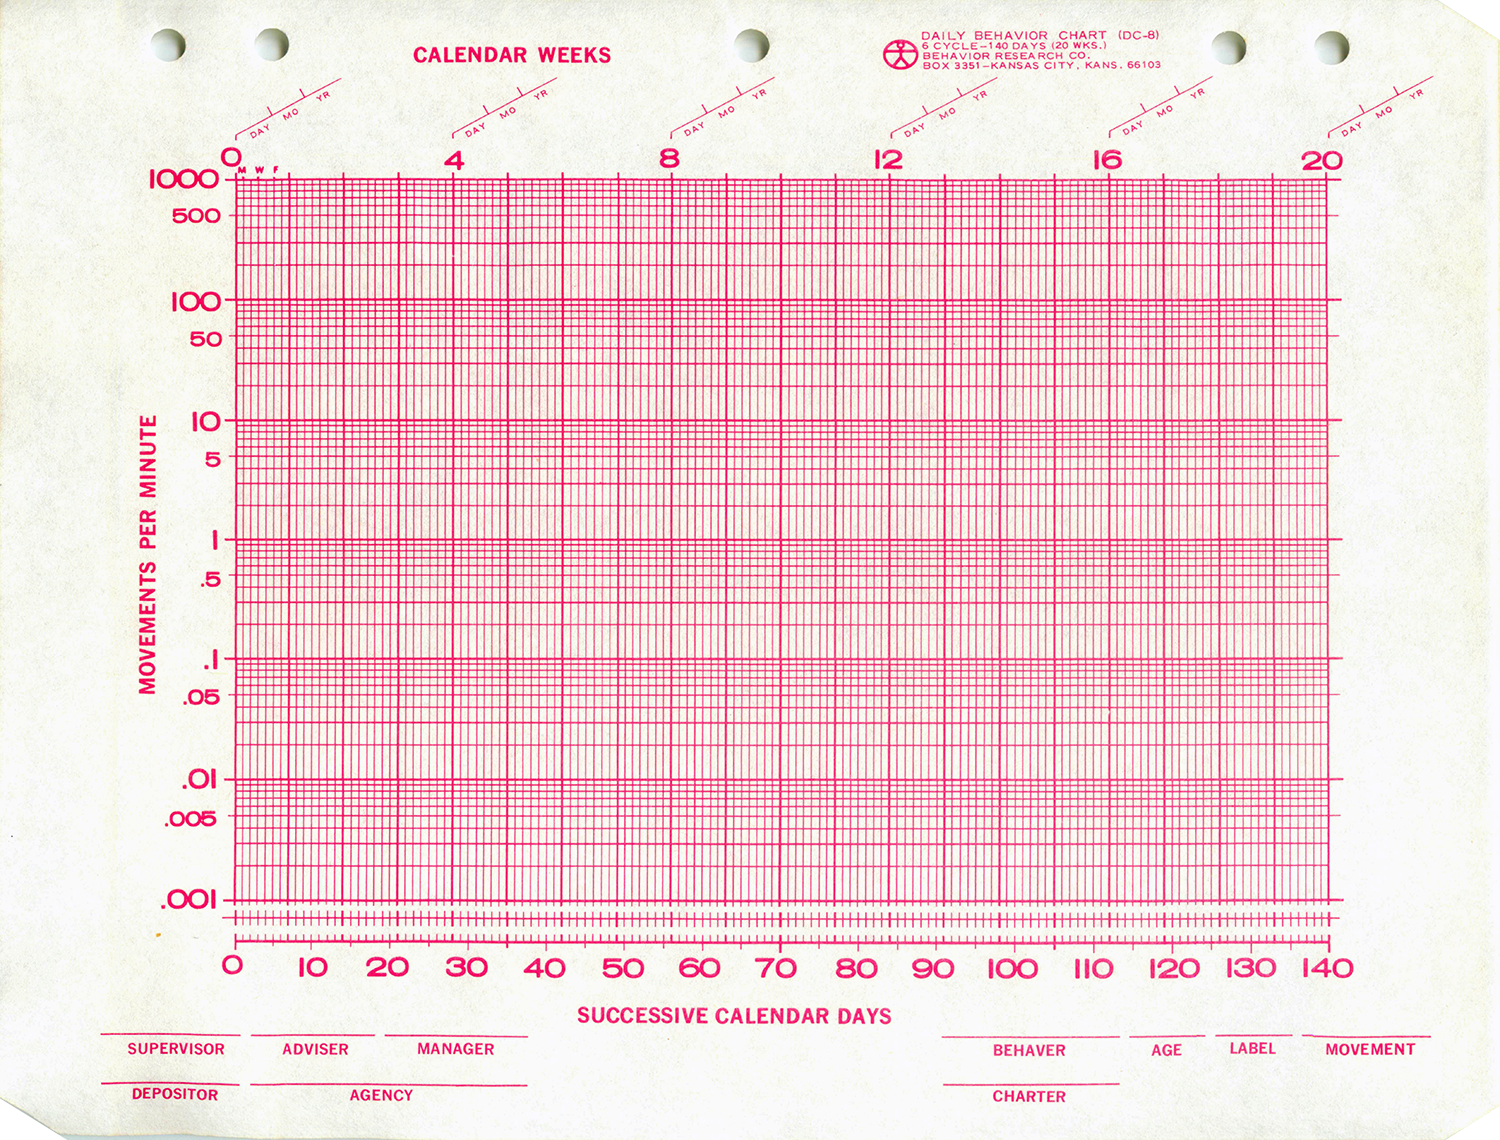
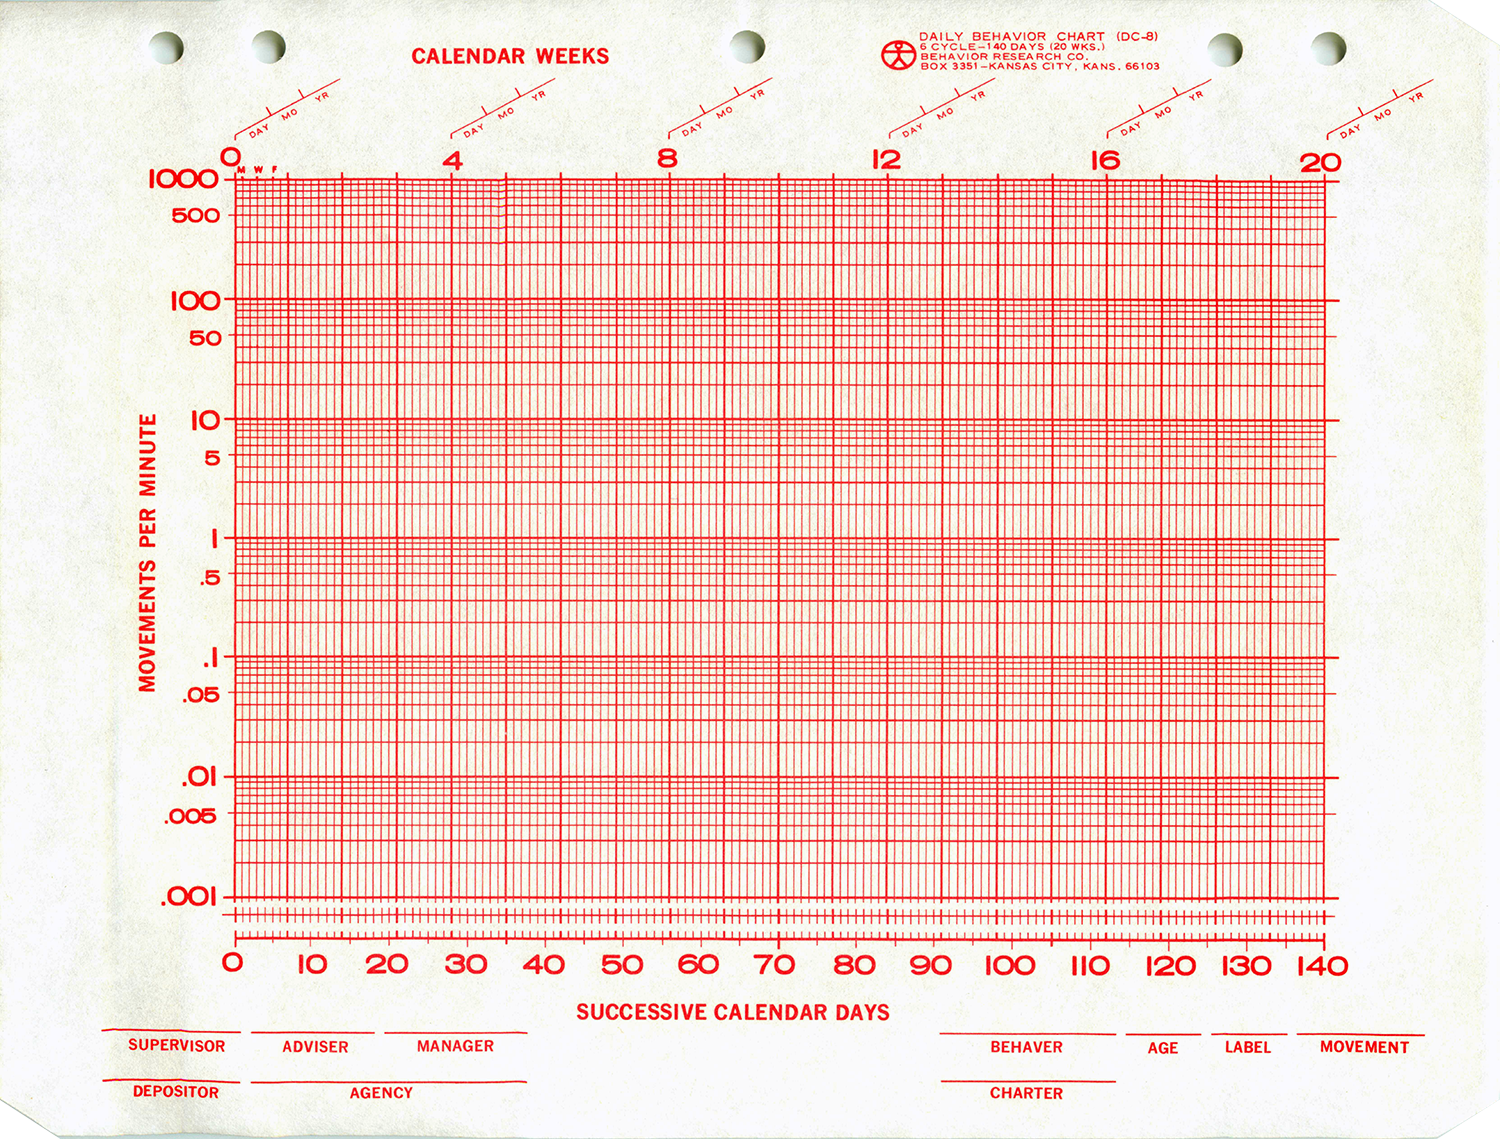
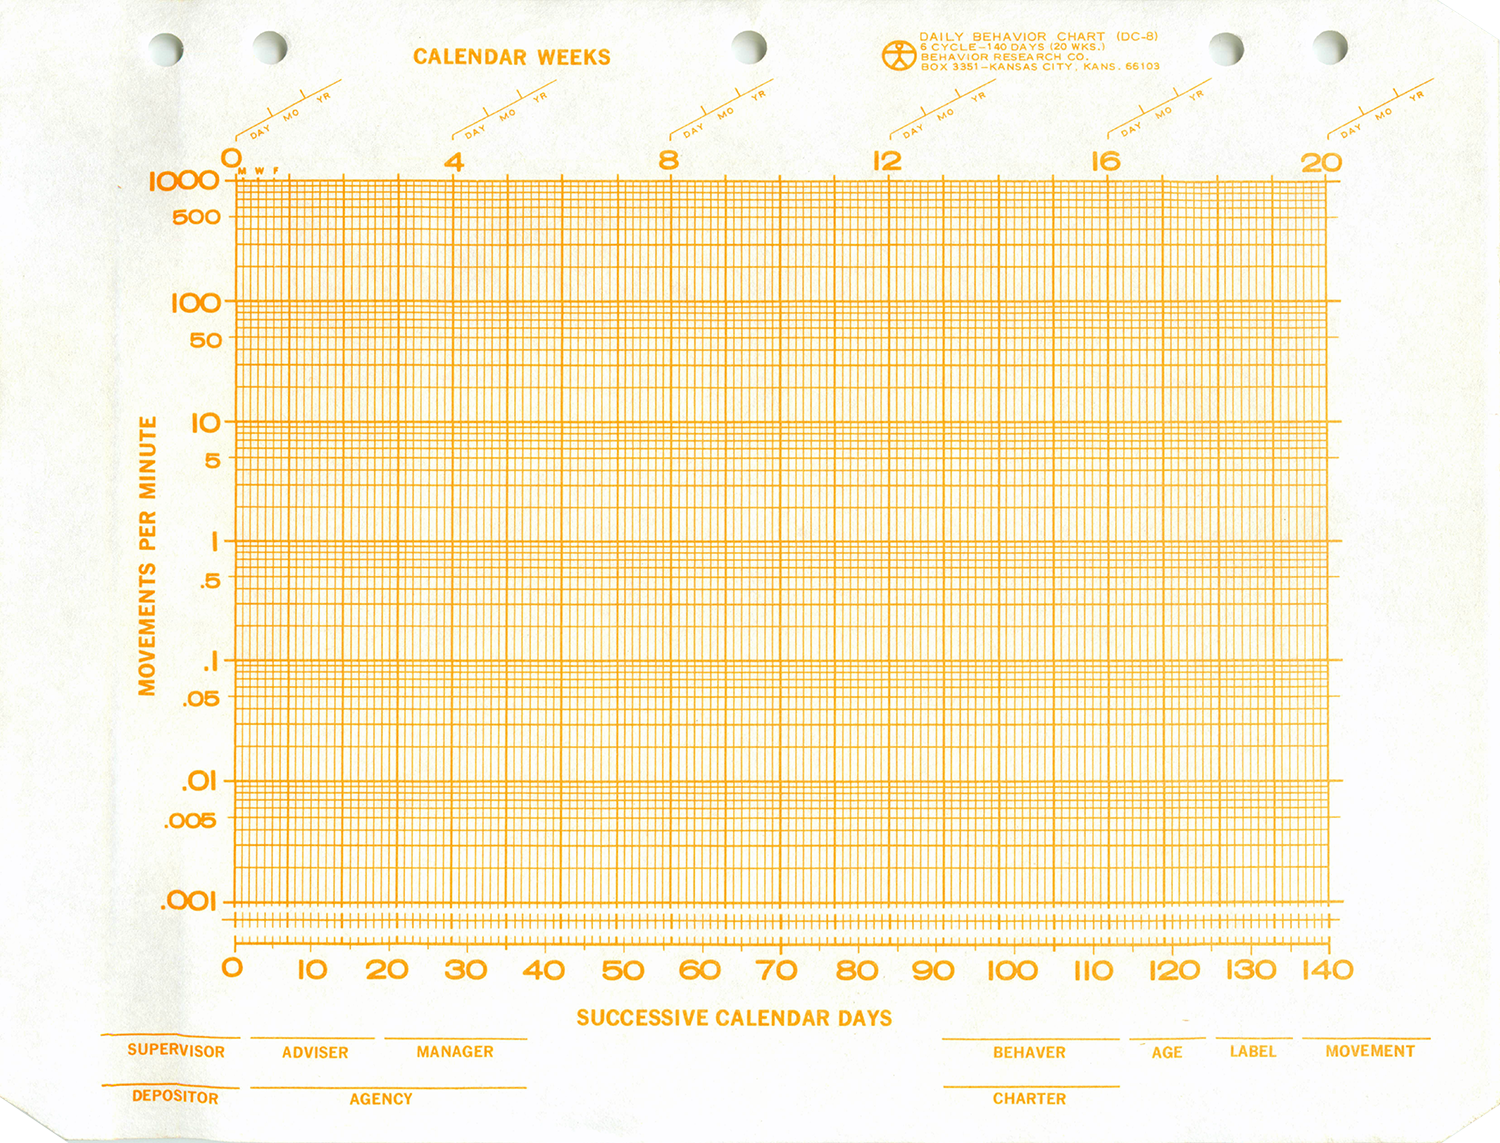
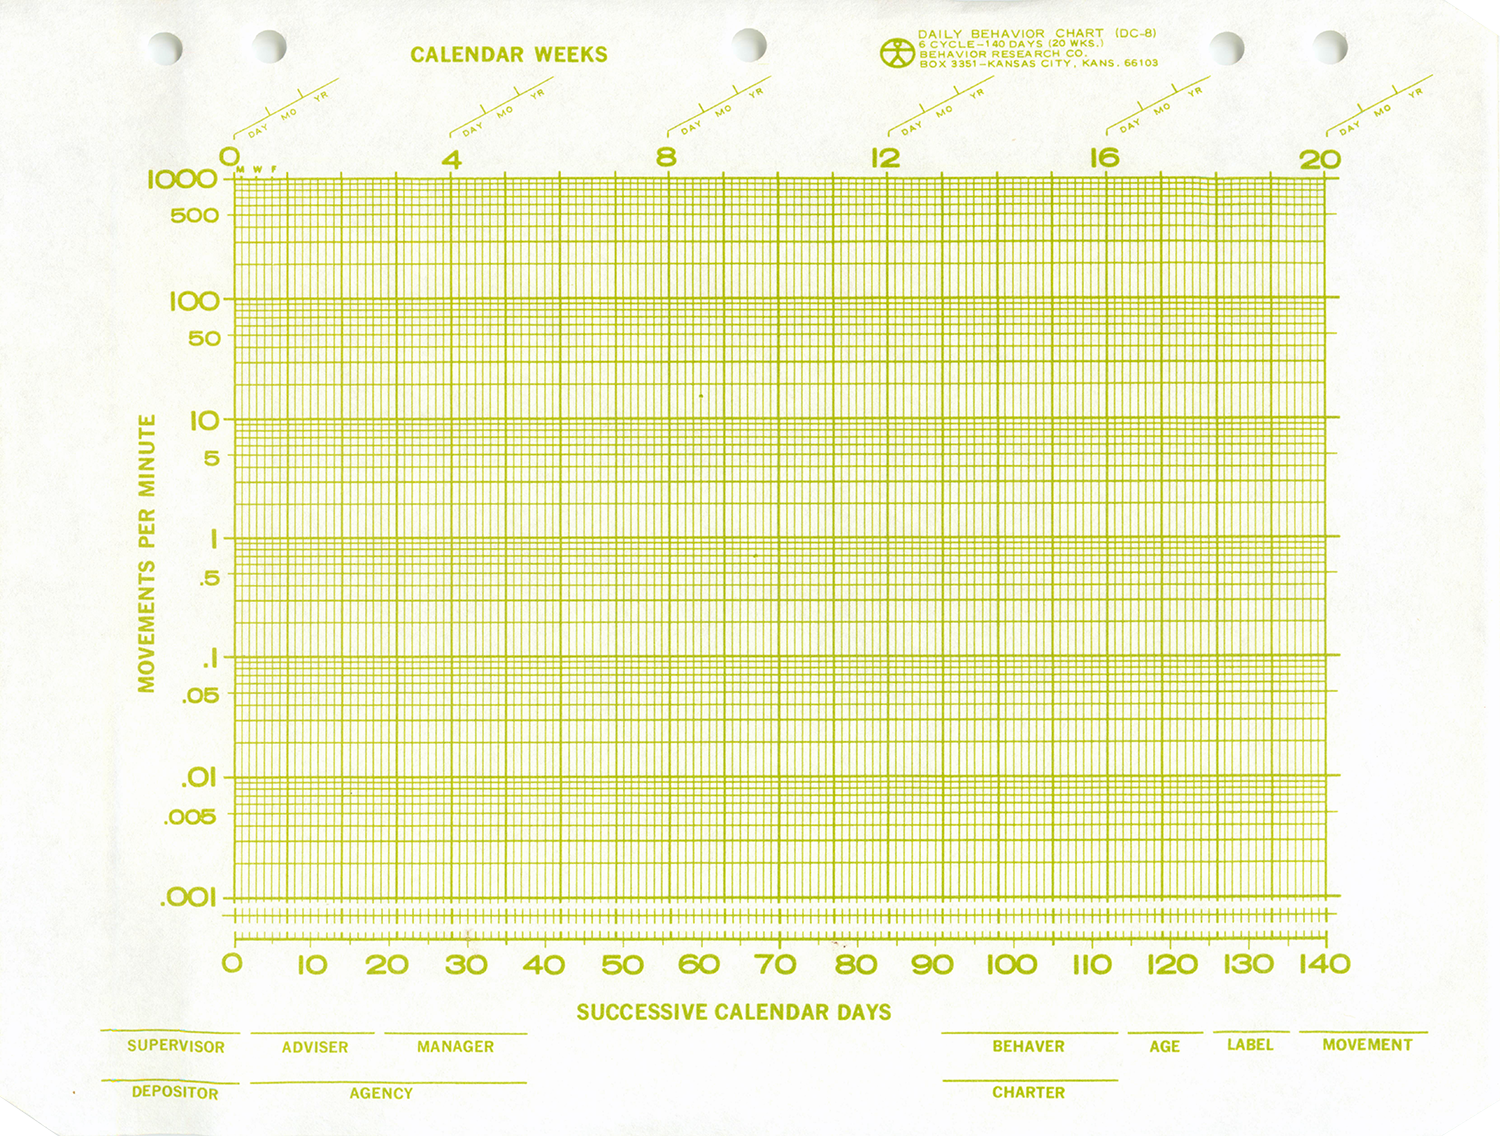
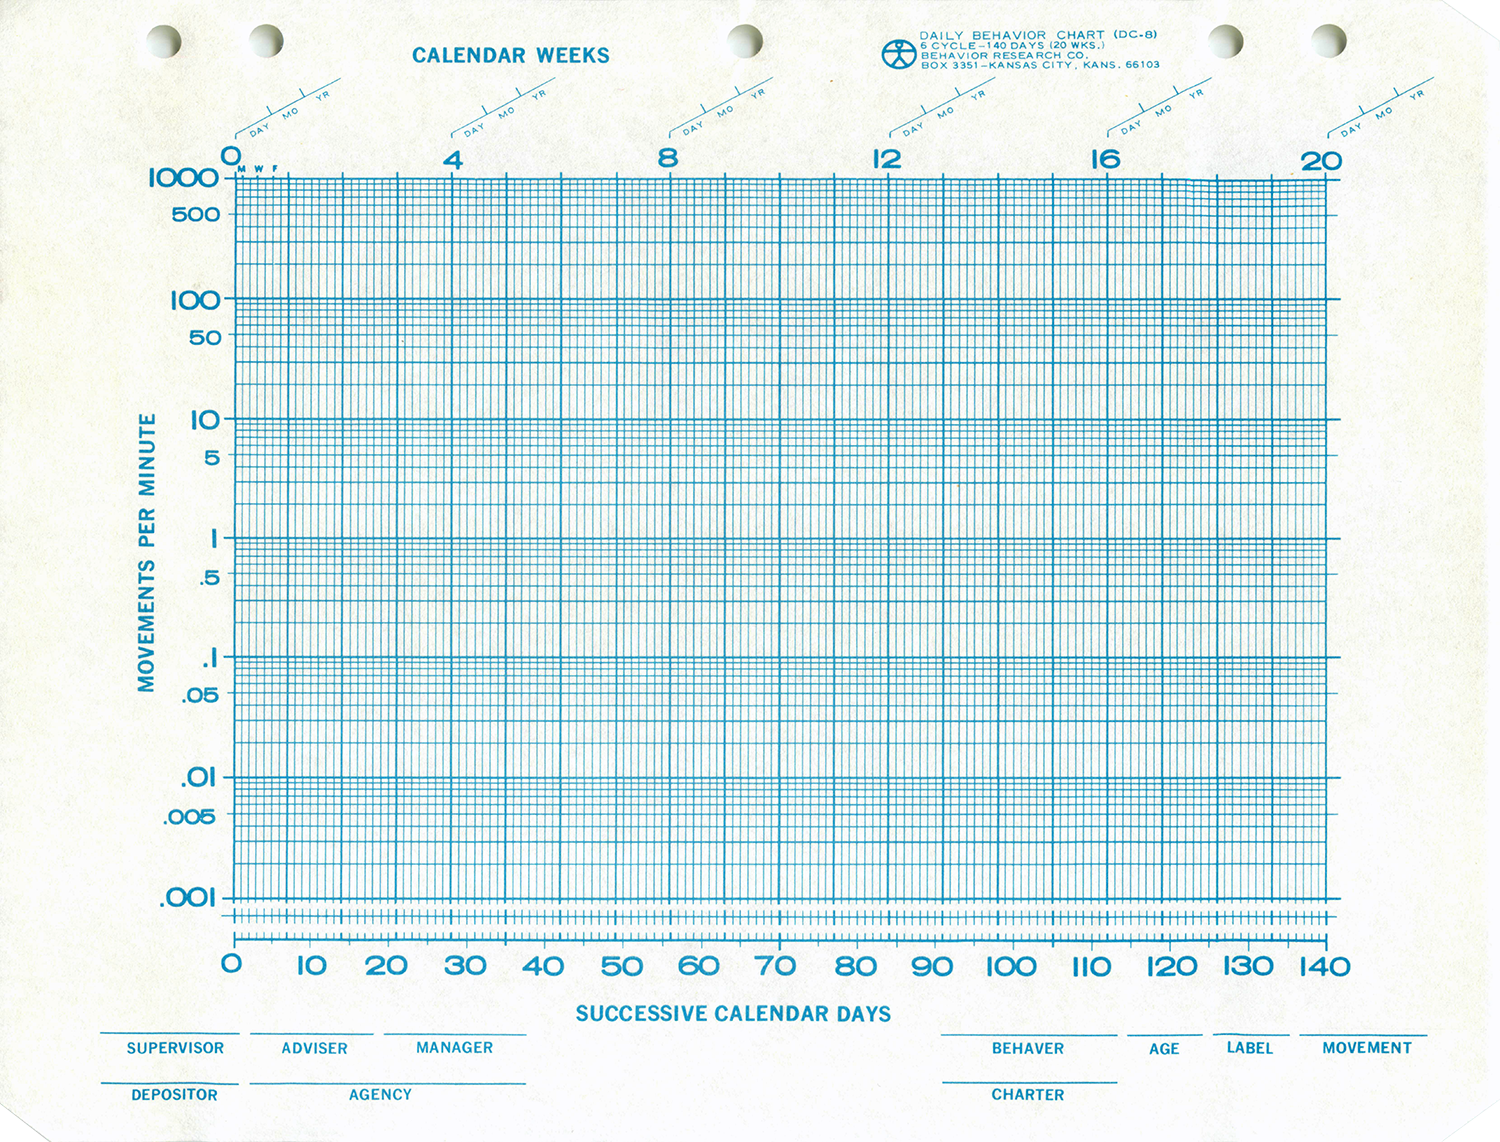
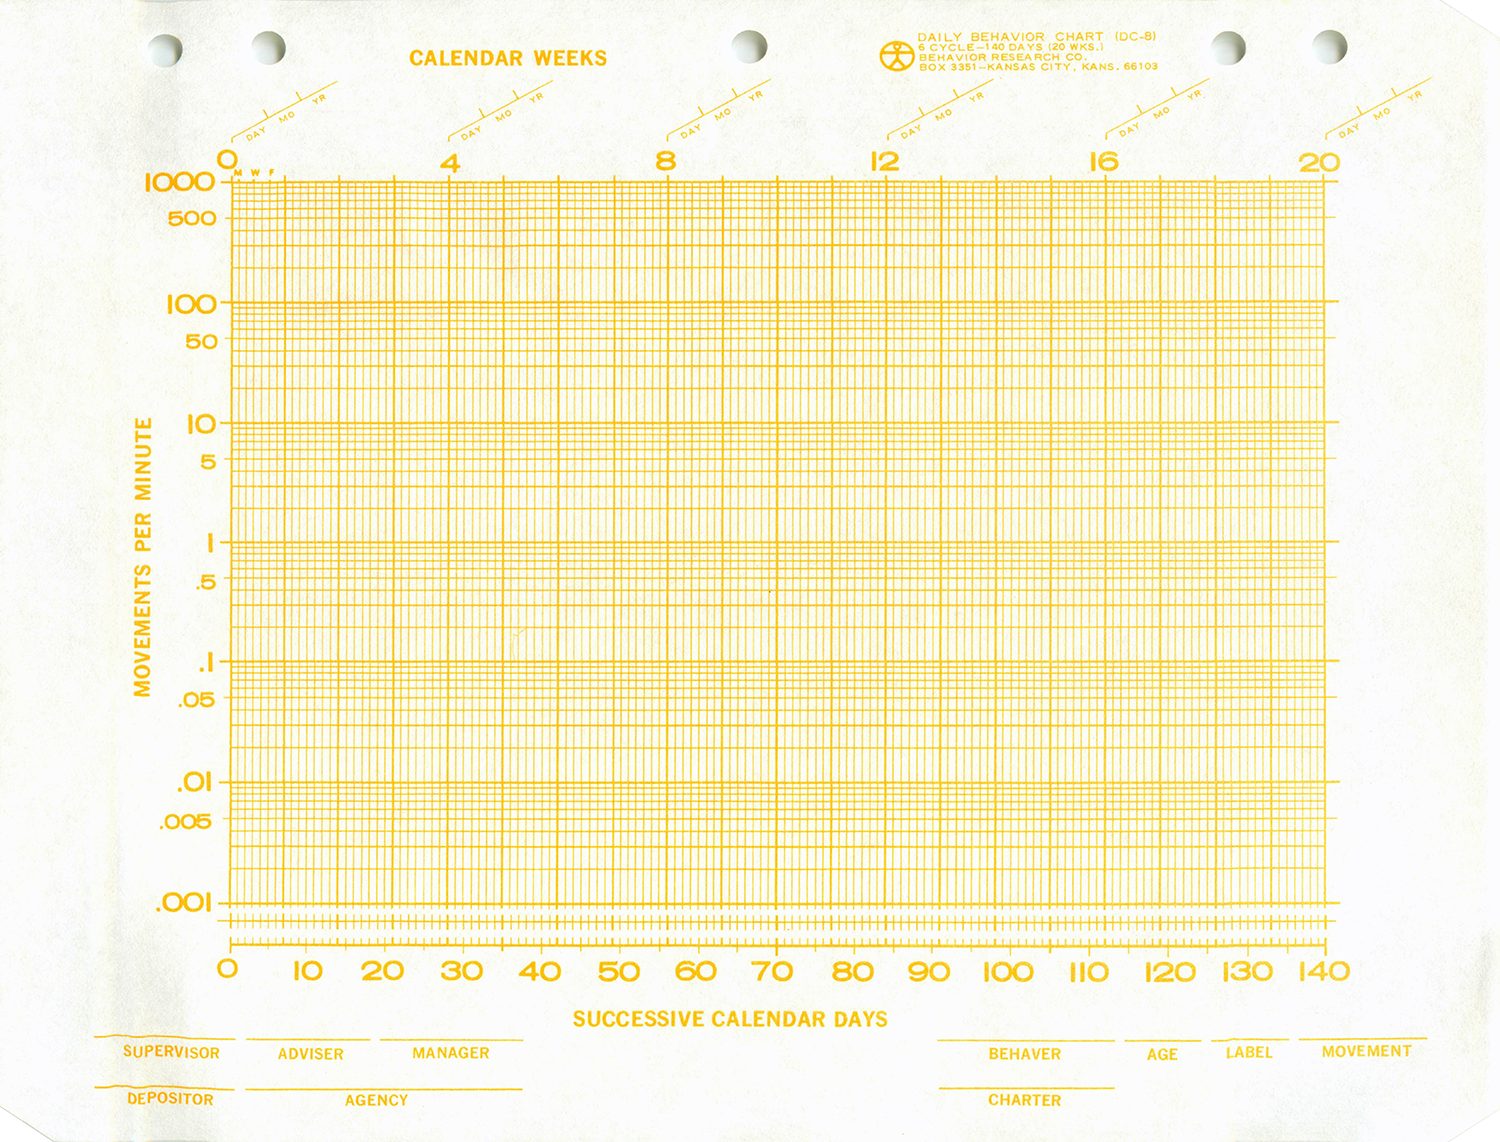
Behavior Research Company standard charts were developed by Ogden Lindsley and his students starting in the 1960s. In order to facilitate better data analysis, data sharing, and dissemination, Ogden adhered to specific standards during printing and further development. The list as it applies to printed charts is as follows:

Standard Chart Standards (Lindsley, 2003)

  1. An aspect ratio that keeps a celeration constant by holding  a 34° for data that is doubling in frequency each celeration period. This helped standardize trend perception for people using standard charts.
  2. A vertical axis of six base 10 logarithm cycles
  3. A horizontal axis of 20 celeration periods
  4. A horizontal axis that is always real time, skipping no days, weeks, etc.
  5. A frame size of 8" wide and 5 1/4" high
  6. Margin sizes 1 11/16" left, 1 5/16" right, 1 7/16" top, and 1 13/16" bottom
  7. Light blue ink (Pantone 310, 311)
  8. A family of four charts, spanning daily, weekly, monthly, and yearly. Ogden did not consider the Tpmin chart a "standard" chart meeting all of these standards.
We occasionally have chart bundles for which the shrink wrap has "broken" or loosened such that they are not properly held together. The charts are fine. When we have them, we sell them at a discount because of the inconvenience. They will arrive wrapped, but the wrapping may not be pretty!
The color of the chart was derived from systematic testing in the 1960s. When Ogden and his students were developing the Standard Celeration Chart, red, orange, yellow, green, blue, purple, and violet inks were printed and used in order to evaluate charter preference and performance.  Of the participants, the general color preference was green.  But the light blue chart produced the highest accuracy and was more resistant to eye-fatigue, so the decision was made to print all Standard Celeration Charts light blue from then on. Historically, Behavior Research Company has used PANTONE 310 C and PANTONE 311 C for printing charts. The original color runs are shown below.
Purple Dpmin Standard Celeration Chart
Violet Dpmin Standard Celeration Chart
Red Dpmin Standard Celeration Chart
Orange Dpmin Standard Celeration Chart
Green Dpmin Standard Celeration Chart
Blue Dpmin Standard Celeration Chart
Yellow Dpmin Standard Celeration Chart