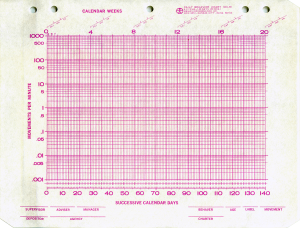
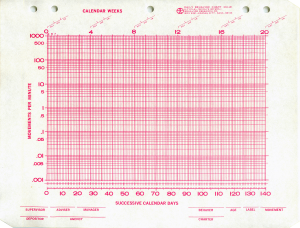
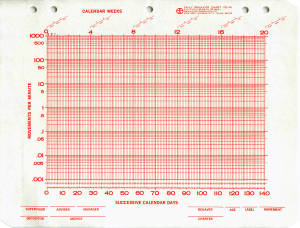
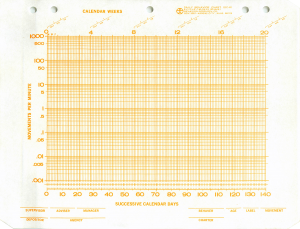
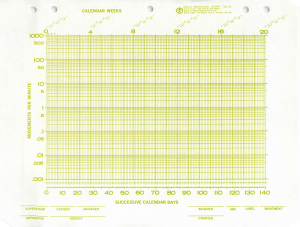
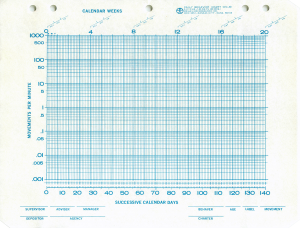
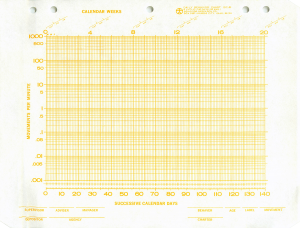
Behavior Research Company standard charts were developed by Ogden Lindsley and his students starting in the 1960s. In order to facilitate better data analysis, data sharing, and dissemination, Ogden adhered to specific standards during printing and further development. The list as it applies to printed charts is as follows:
Standard Chart Standards (Lindsley, 2003)
- An aspect ratio that keeps a celeration constant by holding a 34° for data that is doubling in frequency each celeration period. This helped standardize trend perception for people using standard charts.
- A vertical axis of six base 10 logarithm cycles
- A horizontal axis of 20 celeration periods
- A horizontal axis that is always real time, skipping no days, weeks, etc.
- A frame size of 8" wide and 5 1/4" high
- Margin sizes 1 11/16" left, 1 5/16" right, 1 7/16" top, and 1 13/16" bottom
- Light blue ink (Pantone 310, 311)
- A family of four charts, spanning daily, weekly, monthly, and yearly. Ogden did not consider the Tpmin chart a "standard" chart meeting all of these standards.


